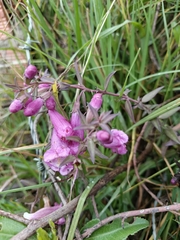
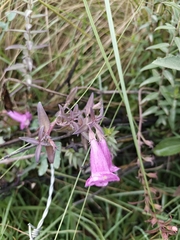
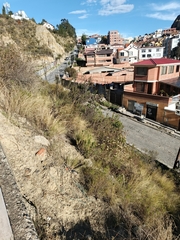
 37 photographs ›
At a glance
- Jan
- Feb
- Mar
- Apr
- May, shaded
- Jun, shaded
- Jul, shaded
- Aug, shaded
- Sep, shaded
- Oct
- Nov
- Dec
Cultivation
Seasons
The rain rule reads a summer growing season: 70% of the median year's rain (818 mm of 1,158 mm) falls in November to March, warmer than the year (wet-season mean 9.6 °C against a yearly mean of 8.3 °C). Months are the habitat's, southern hemisphere; shifted six months for a northern-hemisphere collection: May to September.
Rain
1,158 mm in the median year at the habitat, 818 mm of it November to March. Wettest month January at 240 mm, driest month July at 18 mm. Across the grid cells of the range the year's total runs 846 mm to 1,359 mm, the 10th to 90th percentile of each cell's own year. The median of the cells' own yearly totals, 1,155 mm, is the year's rain at the top of the page; the 1,158 mm here is the median year's, the twelve monthly medians added, which the rain rule reads. Habitat calendar, southern hemisphere; median year across the grid cells of the range, CHELSA.
Light
Open sky over the habitat: 30 to 46 mol/m²/day across the year (daily light integral, median year across the grid cells of the range, CHELSA; the lowest 10th-percentile month across the cells is 29, the highest 90th-percentile month 48).
Warmth and air
Coldest: the 1st-percentile night over 44 years at a typical spot in the range is -4.3 °C, the absolute minimum -6.2 °C, 3,115 frost nights in 44 years, 70.8 a year (NASA POWER daily minima). Warmest: the 99th-percentile day is 21.3 °C. Monthly means: the coldest month's mean nightly low -0.9 °C in July (across the grid cells of the range -2.2 °C to 0.8 °C), the warmest month's mean daily high 14.7 °C in November (median year across the grid cells of the range, CHELSA). Cold floor: -4.3 °C, which is the 1st-percentile night over 44 years at a typical spot in the range (NASA POWER).
Relative humidity at the habitat: 56 to 67% across the year (monthly means, median year across the grid cells of the range, CHELSA). A figure about the air, saying nothing about how the plant takes water.
How this section is made
Each card states this species' habitat figures with their sources, and what two fixed rules read from them; nothing here says what the plant does, wants or tolerates. The rules · the terms.
Seasons. Read from the median year of CHELSA monthly rainfall and mean temperature across the grid cells of the range: the rain rule takes the smallest set of months carrying 70% of the rain and calls it winter when its mean is more than half a degree below the year's, summer when more than that above, and neither in between; the temperature rule, used only under 120 mm, names the cooler six months when they are at least a degree cooler than the other six. Months are shifted for the other hemisphere only where the temperature curve moves 4 °C or more and the habitat lies 10° or more from the equator. A reading of the curves, not an observation of the plant.
Rain. CHELSA monthly precipitation, median year across the grid cells of the range. The rain that falls where the species is recorded; nothing about how the plant takes water.
Light. CHELSA shortwave radiation at each envelope cell, a daily-mean flux taken to a daily total and converted at 2.07 mol of PAR per MJ. The sky over the habitat, measured; what reaches a plant under a rock, a shrub or a shade cloth is not.
Temperature. NASA POWER daily minima and maxima over 44 years at a typical spot in the range, lapse-corrected -183 m to its elevation; CHELSA monthly means, median year across the grid cells of the range. The cold floor is the 1st-percentile night named in its sentence. Not a measured survival limit for any plant in a pot.
Humidity. CHELSA relative humidity, median year across the grid cells of the range.
Climate across the habitat
Habitat months, southern hemisphere
Mean daily high from 12 °C in Jun, Jul and Aug to 15 °C in Nov; mean nightly low from -1 °C in Jul to 5 °C in Jan, Feb, Mar and Dec. The cold quarter, Jun to Aug, is the three months around the coldest month's mean nightly low. 1,158 mm of rain in the median year (the twelve monthly medians added), the wettest month Jan. The bands show the 10th to 90th percentile across 10 habitat cells. Over 44 years at a typical spot in the range (NASA POWER) the absolute minimum was -6.2 °C and the 99th-percentile day 21.3 °C; neither is dated to a month. Beneath: daily light integral and relative humidity through the year, each on its own scale.
Figures by month
| Figure | Jan | Feb | Mar | Apr | May | Jun | Jul | Aug | Sep | Oct | Nov | Dec |
|---|---|---|---|---|---|---|---|---|---|---|---|---|
| Day °C | 14 / 12–16 | 14 / 12–16 | 14 / 12–16 | 14 / 12–16 | 13 / 12–15 | 12 / 11–15 | 12 / 10–14 | 12 / 11–15 | 13 / 11–16 | 14 / 13–17 | 15 / 13–17 | 14 / 13–16 |
| Night °C | 5 / 4–7 | 5 / 4–7 | 5 / 3–6 | 4 / 2–5 | 1 / 0–3 | 0 / -2–1 | -1 / -2–1 | 0 / -1–2 | 1 / 0–3 | 3 / 2–5 | 4 / 3–6 | 5 / 4–7 |
| Rain mm | 240 / 185–272 | 181 / 136–207 | 136 / 102–157 | 73 / 51–89 | 29 / 16–38 | 23 / 12–29 | 18 / 10–24 | 44 / 27–54 | 64 / 44–77 | 89 / 64–107 | 99 / 73–118 | 162 / 120–189 |
| DLI | 43 / 39–45 | 42 / 39–44 | 39 / 37–41 | 35 / 34–36 | 33 / 32–35 | 30 / 29–33 | 31 / 30–33 | 35 / 34–37 | 40 / 39–41 | 44 / 43–45 | 46 / 43–48 | 45 / 40–47 |
| RH % | 67 / 65–69 | 67 / 65–69 | 66 / 65–67 | 63 / 62–64 | 57 / 55–58 | 56 / 54–57 | 57 / 55–58 | 59 / 57–61 | 61 / 60–63 | 62 / 60–64 | 62 / 62–64 | 65 / 63–66 |
How this section is made
Natural habitat
How this section is made
Photographs
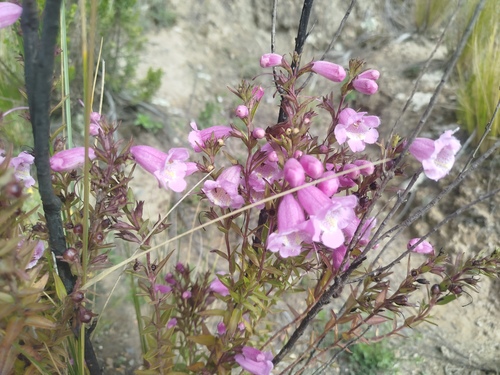
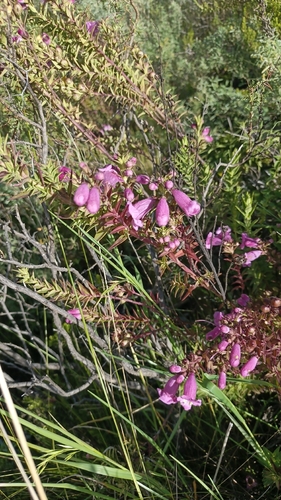
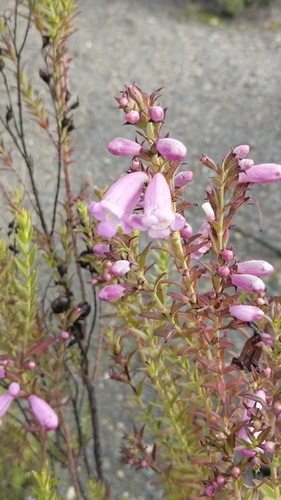
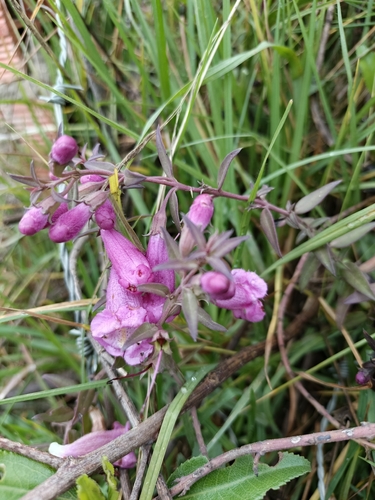
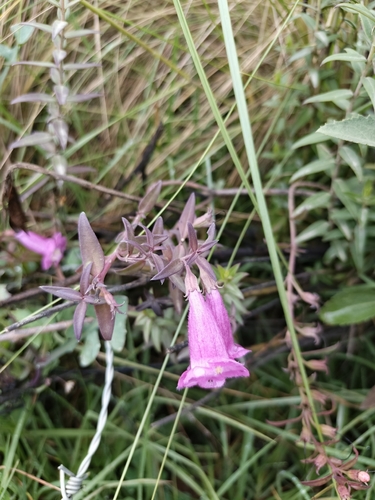
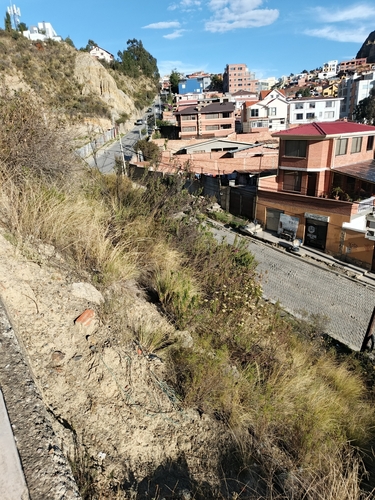
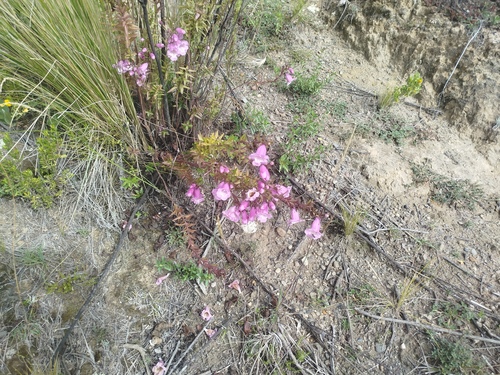
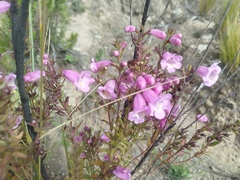
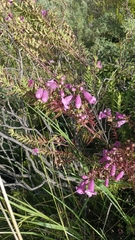
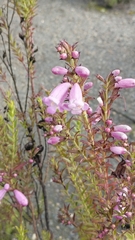
Photographs: (c) Humber Alberto, some rights reserved (CC BY); author not stated, no rights reserved · CC0 (5).
Related
Similar habitat climate The 6 nearest by mean daily high, mean nightly low and rain, month by month. How.
 Dasyphyllum ferox Asteraceae Photo: CC BY-SA, Carlo Brescia
 Puya herzogii Bromeliaceae Photo: CC BY, Andrés Romero Bravo
 Senna aymara Fabaceae Photo: CC BY, Thomaz Ricardo Favreto Sinani
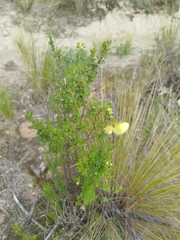 Calceolaria sparsiflora Calceolariaceae Photo: CC BY, Humber Alberto
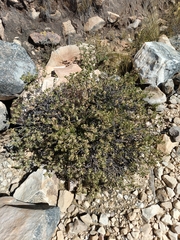 Baccharis papillosa Asteraceae Photo: CC0, author not stated
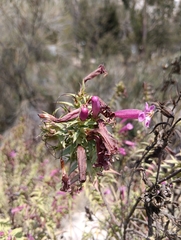 Agalinis bangii Orobanchaceae Photo: CC BY, Andrés Romero Bravo
Other Agalinis 8 in the reference
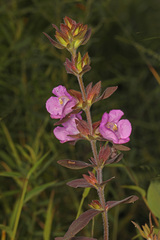 Agalinis auriculata Earleaf false foxglove Photo: CC BY-SA, Judy Gallagher Agalinis bangii Orobanchaceae Photo: CC BY, Andrés Romero Bravo
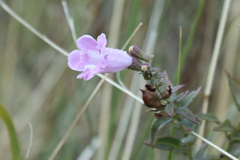 Agalinis genistifolia Orobanchaceae Photo: CC BY, Holger Braun
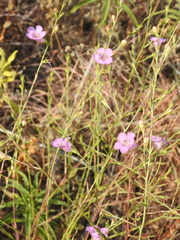 Agalinis heterophylla Prairie agalinis Photo: CC BY, saltyhiker
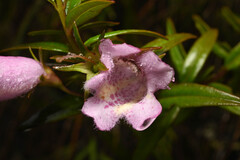 Agalinis lanceolata Orobanchaceae Photo: CC BY, Anders Hastings
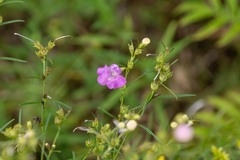 Agalinis purpurea Purple false foxglove Photo: CC BY, Andrew Lai
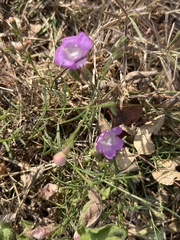 Agalinis strictifolia Stiffleaf false foxglove Photo: CC0, author not stated
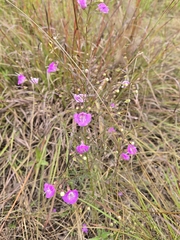 Agalinis tenuifolia Slender-leaved false foxglove Photo: CC BY, Edie
Names & registers
Also known as Agalinis ovatifolia; Gerardia brevifolia; Gerardia ovatifolia. (GBIF Backbone)
The record
Every figure here is derived from public data by a stated rule and names its source; nothing about this species is written for its page by a person or by AI, apart from the marked, credited quotations. How →
Where this page came from built 2026-10-21
gbif.species answeredasked 2026-10-21gbif.synonyms answeredasked 2026-10-21gbif.vernacular answeredasked 2026-10-21names fetched 2026-10-21wcvp.distribution answeredas of 2026-06-04gbif.occurrences answeredas of 2026-10-21GBIF occurrence download https://doi.org/10.15468/dl.hbdw64, of 2026-10-21; 9 records within 1 km of a botanic garden, herbarium or zoo left out (9 at a botanic garden or arboretum; Wikidata's list)climate answeredasked 2026-10-21climate.extremes answeredasked 2026-10-21NASA POWER (MERRA-2) daily 1981–2024, cell -16.50_-68.125, lapse-corrected -183 m at 6.5 °C/kmwikidata answeredasked 2026-10-21wikipedia nothing to reportasked 2026-10-21inat.photos.wild answeredasked 2026-10-22from iNaturalist's open data of 2026-09-27: research-grade observations with an open-licence photograph, the 24 whose photographs iNaturalist received last (the open data holds no votes); filled 2026-10-22inat.photos.cultivated not askedgbif.media answeredasked 2026-10-21none of the photographs on this page is credited to GBIF: those shown are other sources', and GBIF's were the same photographs or were set aside by the photograph rulesopenalex not askednot yet asked for this reference; a later fill takes the papers from OpenAlex's snapshotEvery source is recorded as having answered, reported nothing, refused, failed, not been asked, or answered twice where one answer is taken (“not taken: two items answered”), and, for a source asked when this page was built, when: the figures are as the source held them that day; a source read from a file (Kew's World Checklist, a GBIF download) says "as of" the file's day instead; a row carried from an earlier build of the page names that build instead. Only “nothing to report” is ever shown as an absence. Records came from 5 datasets via GBIF.org; each carries its own licence.