 61 photographs ›
At a glance
- Jan
- Feb
- Mar
- Apr, shaded
- May, shaded
- Jun, shaded
- Jul, shaded
- Aug, shaded
- Sep, shaded
- Oct, shaded
- Nov
- Dec
Summary
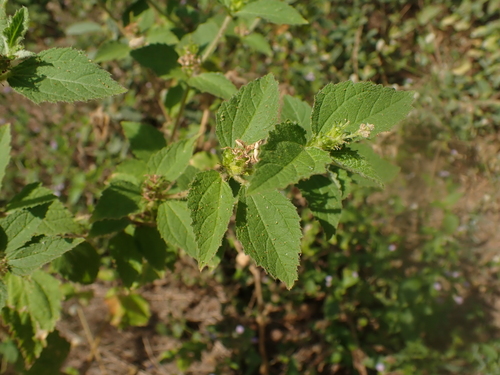
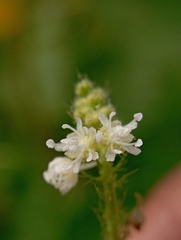
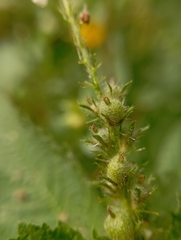
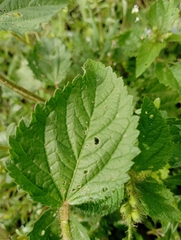
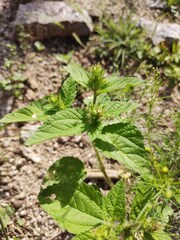
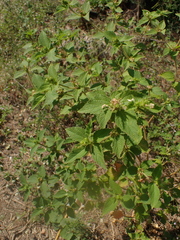
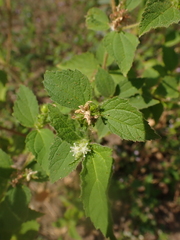
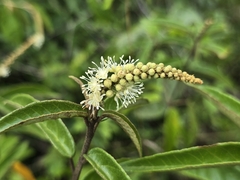
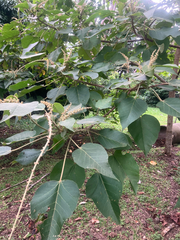
Croton hirtus, the hairy croton, is a species of flowering plant in the family Euphorbiaceae. It is an annual herb native to regions from Mexico to tropical Argentina, occurring mainly in wet tropical biomes. The species has also been introduced to parts of Asia and Africa, and is known for its traditional medicinal uses.
Quoted from Wikipedia, "Croton hirtus", CC BY-SA 4.0.
Cultivation
Seasons
The rain rule reads a sharp season: 70% of the median year's rain (1,283 mm of 1,634 mm) falls in April to October. The temperature curve is flat, 1.1 °C between the warmest and coldest month, so the growing-season rule does not infer a growing season from it. Months are the habitat's, southern hemisphere. The habitat lies within 10° of the equator, where the shift rule does not apply, so they are not shifted for a collection elsewhere.
Rain
1,634 mm in the median year at the habitat, 1,283 mm of it April to October. Wettest month June at 224 mm, driest month January at 55 mm. Across the grid cells of the range the year's total runs 928 mm to 3,288 mm, the 10th to 90th percentile of each cell's own year. The median of the cells' own yearly totals, 1,703 mm, is the year's rain at the top of the page; the 1,634 mm here is the median year's, the twelve monthly medians added, which the rain rule reads. Habitat calendar, southern hemisphere; median year across the grid cells of the range, CHELSA.
Light
Open sky over the habitat: 30 to 37 mol/m²/day across the year (daily light integral, median year across the grid cells of the range, CHELSA; the lowest 10th-percentile month across the cells is 25, the highest 90th-percentile month 46).
Warmth and air
Coldest: the 1st-percentile night over 44 years at a typical spot in the range is 21.5 °C, the absolute minimum 19.1 °C, no frost in 44 years (NASA POWER daily minima). Warmest: the 99th-percentile day is 42.4 °C. Monthly means: the coldest month's mean nightly low 21.9 °C in January (across the grid cells of the range 14.3 °C to 24.0 °C), the warmest month's mean daily high 29.9 °C in April (median year across the grid cells of the range, CHELSA). Cold floor: 21.5 °C, which is the 1st-percentile night over 44 years at a typical spot in the range (NASA POWER).
Relative humidity at the habitat: 61 to 67% across the year (monthly means, median year across the grid cells of the range, CHELSA). A figure about the air, saying nothing about how the plant takes water.
How this section is made
Each card states this species' habitat figures with their sources, and what two fixed rules read from them; nothing here says what the plant does, wants or tolerates. The rules · the terms.
Seasons. Read from the median year of CHELSA monthly rainfall and mean temperature across the grid cells of the range: the rain rule takes the smallest set of months carrying 70% of the rain and calls it winter when its mean is more than half a degree below the year's, summer when more than that above, and neither in between; the temperature rule, used only under 120 mm, names the cooler six months when they are at least a degree cooler than the other six. Months are shifted for the other hemisphere only where the temperature curve moves 4 °C or more and the habitat lies 10° or more from the equator. A reading of the curves, not an observation of the plant.
Rain. CHELSA monthly precipitation, median year across the grid cells of the range. The rain that falls where the species is recorded; nothing about how the plant takes water.
Light. CHELSA shortwave radiation at each envelope cell, a daily-mean flux taken to a daily total and converted at 2.07 mol of PAR per MJ. The sky over the habitat, measured; what reaches a plant under a rock, a shrub or a shade cloth is not.
Temperature. NASA POWER daily minima and maxima over 44 years at a typical spot in the range, lapse-corrected -71 m to its elevation; CHELSA monthly means, median year across the grid cells of the range. The cold floor is the 1st-percentile night named in its sentence. Not a measured survival limit for any plant in a pot.
Humidity. CHELSA relative humidity, median year across the grid cells of the range.
Climate across the habitat
Habitat months, southern hemisphere
Mean daily high from 28 °C in Jan and Dec to 30 °C in Apr and May; mean nightly low from 22 °C in Jan, Feb, Nov and Dec to 23 °C in Mar, Apr, May, Jun, Jul, Aug, Sep and Oct. The cold quarter, Nov to Jan, is the three months around the coldest month's mean nightly low, centred on the 4 months in a row that tie for it. 1,634 mm of rain in the median year (the twelve monthly medians added), the wettest month Jun. The bands show the 10th to 90th percentile across 199 habitat cells. Over 44 years at a typical spot in the range (NASA POWER) the absolute minimum was 19.1 °C and the 99th-percentile day 42.4 °C; neither is dated to a month. Beneath: daily light integral and relative humidity through the year, each on its own scale.
Figures by month
| Figure | Jan | Feb | Mar | Apr | May | Jun | Jul | Aug | Sep | Oct | Nov | Dec |
|---|---|---|---|---|---|---|---|---|---|---|---|---|
| Day °C | 28 / 25–32 | 29 / 25–33 | 29 / 26–33 | 30 / 27–33 | 30 / 26–33 | 29 / 26–32 | 29 / 26–32 | 29 / 26–32 | 29 / 25–32 | 29 / 25–32 | 29 / 25–32 | 28 / 25–32 |
| Night °C | 22 / 14–24 | 22 / 15–24 | 23 / 15–24 | 23 / 17–24 | 23 / 18–25 | 23 / 18–24 | 23 / 18–24 | 23 / 18–25 | 23 / 18–25 | 23 / 17–25 | 22 / 16–25 | 22 / 15–24 |
| Rain mm | 55 / 8–307 | 57 / 8–255 | 72 / 7–301 | 146 / 12–357 | 193 / 48–442 | 224 / 70–406 | 202 / 50–361 | 175 / 16–375 | 196 / 12–403 | 147 / 11–384 | 111 / 13–273 | 56 / 12–280 |
| DLI | 33 / 25–37 | 36 / 28–39 | 37 / 31–43 | 34 / 29–46 | 32 / 26–44 | 32 / 26–39 | 33 / 27–37 | 35 / 29–39 | 33 / 29–41 | 32 / 28–43 | 31 / 26–42 | 30 / 25–39 |
| RH % | 63 / 54–69 | 61 / 53–68 | 61 / 54–68 | 62 / 55–69 | 65 / 56–71 | 67 / 59–71 | 66 / 58–70 | 66 / 57–70 | 66 / 58–71 | 65 / 60–71 | 64 / 57–70 | 63 / 55–70 |
Records on both sides of the equator: the 32 cells at least 10° south of it have seasons six months apart and are left out, not combined into a year no place has. These figures are across the 199 cells that remain: the 95 at least 10° north and the 104 within 10° of the equator, which stay in either way.
How this section is made
Natural habitat
How this section is made
Photographs
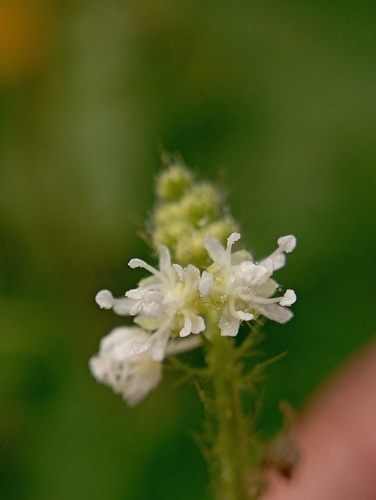
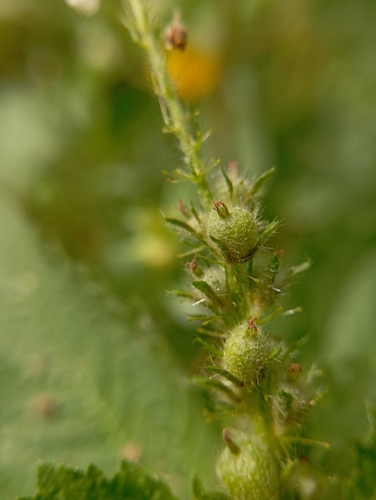
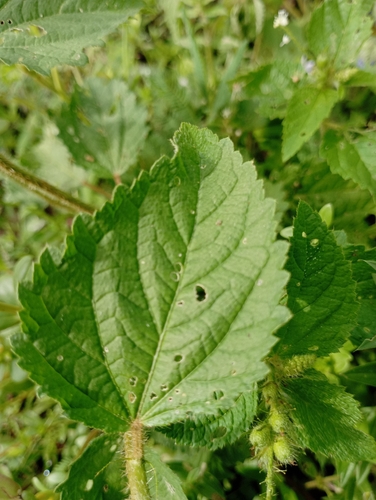

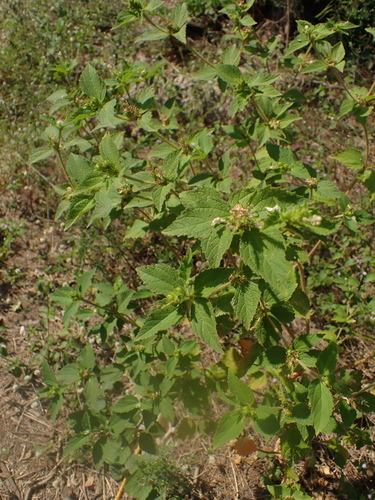
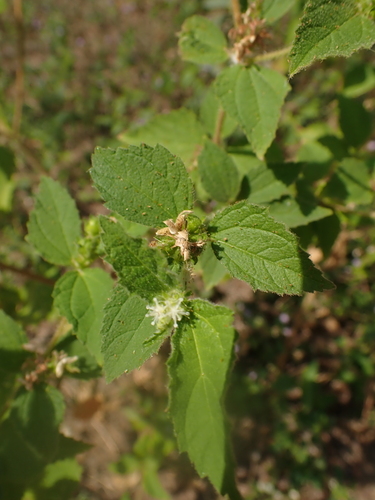
Photographs: (c) Gustavo Heleno Ferreira, some rights reserved (CC BY) (3); (c) Lucas Carbone, some rights reserved (CC BY); author not stated, no rights reserved · CC0 (2).
Related
Similar habitat climate The 6 nearest by mean daily high, mean nightly low and rain, month by month. How.
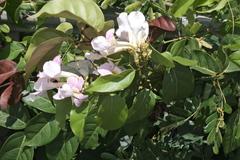 Bignonia aequinoctialis Garlicvine Photo: CC BY, fmunoz
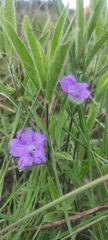 Ruellia geminiflora Acanthaceae Photo: CC BY, fmunoz
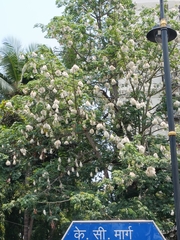 Ceiba pentandra Silk cotton tree Photo: CC BY, Malaika Mathew Chawla
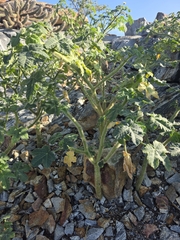 Cnidoscolus urens Bull-nettle Photo: CC BY, Marcello Mastroianni Albuquerque Araújo
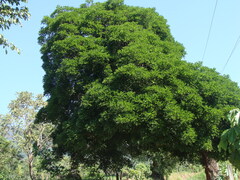 Andira inermis Cabbagebark tree Photo: CC BY, Alexis López Hernández
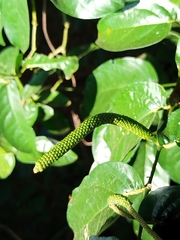 Piper tuberculatum Monkey pepper Photo: CC BY, Gabriel M. Rolim
Other Croton 49 in the reference
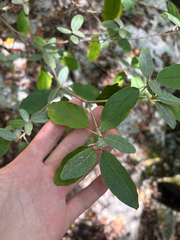 Croton alabamensis Alabama croton Photo: CC0, author not stated
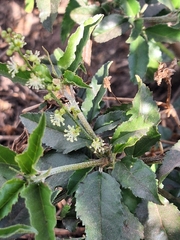 Croton bonplandianus Bonpland's croton Photo: CC BY, Rocío Esmeralda Pose
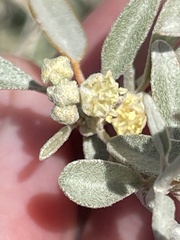 Croton californicus California croton Photo: CC0, author not stated
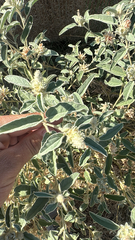 Croton capitatus Woolly croton Photo: CC BY, CH Hemphill
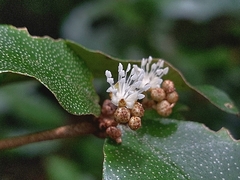 Croton cascarilloides Euphorbiaceae Photo: CC BY-SA, vrxz
 Croton chilensis Euphorbiaceae Photo: CC BY, Nicolás Lavandero
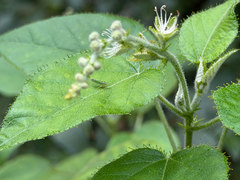 Croton ciliatoglandulifer Bush croton Photo: CC BY, Cody Hinchliff
 Croton coriaceus Euphorbiaceae Photo: CC BY, Dick Culbert
 Croton cortesianus Cortez's croton Photo: CC BY-SA, Jalil R.
 Croton draco Weeping blood Photo: CC BY, River Ahlquist Croton elegans Euphorbiaceae Croton eluteria Cascarilla all 50 ›
Names & registers
Also known as Brachystachys hirta; Croton comes; Croton glandulosus subsp. hirtus; Croton glandulosus var. cordovensis; Croton glandulosus var. hirtus and 8 more. (GBIF Backbone)
The record
Every figure here is derived from public data by a stated rule and names its source; nothing about this species is written for its page by a person or by AI, apart from the marked, credited quotations. How →
Where this page came from built 2026-10-22
gbif.species answeredasked 2026-10-22gbif.synonyms answeredasked 2026-10-22gbif.vernacular answeredasked 2026-10-22names fetched 2026-10-22wcvp.distribution answeredas of 2026-06-04gbif.occurrences answeredas of 2026-10-21GBIF occurrence download https://doi.org/10.15468/dl.hbdw64, of 2026-10-21; 25 records within 1 km of a botanic garden, herbarium or zoo left out (5 at a botanic garden or arboretum, 18 at a herbarium, 2 at a zoo; Wikidata's list)climate answeredasked 2026-10-22climate.extremes answeredasked 2026-10-22NASA POWER (MERRA-2) daily 1981–2024, cell 10.00_-73.750, lapse-corrected -71 m at 6.5 °C/kmwikidata answeredasked 2026-10-22wikipedia answeredasked 2026-10-22inat.photos.wild answeredasked 2026-10-22from iNaturalist's open data of 2026-09-27: research-grade observations with an open-licence photograph, the 24 whose photographs iNaturalist received last (the open data holds no votes); filled 2026-10-22inat.photos.cultivated not askedgbif.media answeredasked 2026-10-22openalex not askednot yet asked for this reference; a later fill takes the papers from OpenAlex's snapshotEvery source is recorded as having answered, reported nothing, refused, failed, not been asked, or answered twice where one answer is taken (“not taken: two items answered”), and, for a source asked when this page was built, when: the figures are as the source held them that day; a source read from a file (Kew's World Checklist, a GBIF download) says "as of" the file's day instead; a row carried from an earlier build of the page names that build instead. Only “nothing to report” is ever shown as an absence. Records came from 175 datasets via GBIF.org; each carries its own licence.