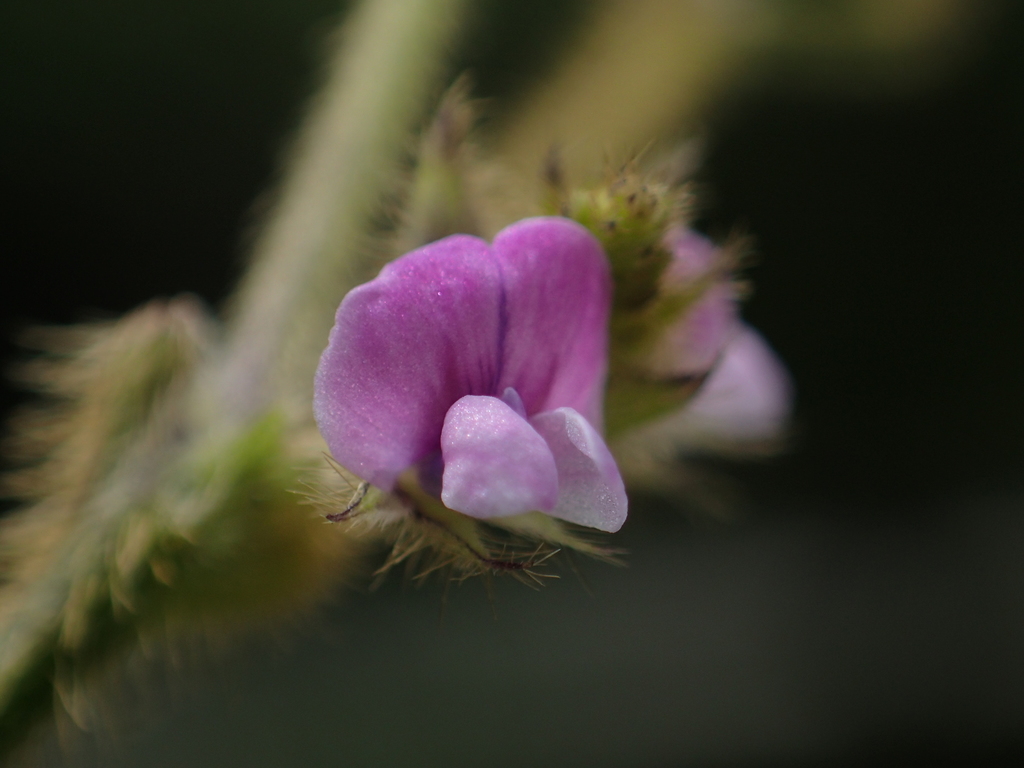
Glycine max (L.) Merr.
Soojabuan, Soya-Bean, Soyabean, Soybean
Every figure on this page is derived from public data by a stated rule and says its source; nothing here is written by a person or a model, except the Wikipedia passage, which is quoted and marked as such. How it is made.
Summary
The soybean, soy bean, or soya bean is a species of legume native to East Asia, widely grown for its edible bean. Soy is a staple crop, the world's most grown legume, and an important animal feed.
Text from Wikipedia, “Soybean”, CC BY-SA 4.0, quoted as written. Kept separate from everything derived here.
About the genus · Glycine
Glycine (symbol Gly or G; ) is an organic compound with the formula C2H5NO2, and is the simplest stable amino acid, distinguished by having a single hydrogen atom as its side chain. As one of the 20 proteinogenic amino acids, glycine is a fundamental building block of proteins in all life and is encoded by all codons starting with GG (GGU, GGC, GGA, and GGG). Because of its minimal side chain, it is the only common amino acid that is not chiral, meaning it is superimposable on its mirror image.
Text from Wikipedia, “Glycine”, CC BY-SA 4.0, quoted as written.
At a glance
Also known as Dolichos sofa L.; Glycine angustifolia Miq.; Glycine formosa Hosok.; Glycine javanica Thunb.; Glycine mas and 4 more.
Cultivation
Its year Rain rule: a summer growing season, May to September in the northern hemisphere (May to September at the habitat, northern).
This species’ habitat figures, and what two fixed rules read from them.
The rain rule reads a summer growing season: 70% of the year's rain (909 mm of 1265 mm) falls in May to September, warmer than the year (wet-season mean 21.9 °C against a yearly mean of 13.0 °C). Months are the habitat's, northern hemisphere; shifted six months for a southern-hemisphere collection: November to March.
Read from the median year of CHELSA monthly rainfall and mean temperature across the envelope cells: the rain rule takes the smallest set of months carrying 70% of the rain and calls it winter when its mean is more than half a degree below the year's, summer when more than that above, and neither in between; the temperature rule, used only under 120 mm, names the cooler six months when they are at least a degree cooler than the other six. Months are shifted for the other hemisphere only where the temperature curve gives a season to reverse. A reading of the curves, not an observation of the plant.
Rain Habitat rain 1265 mm a year, wettest July at 246 mm, driest December at 28 mm (habitat calendar, northern hemisphere).
This species’ habitat figures, with their source.
1265 mm a year at the habitat, 909 mm of it May to September. Wettest month July at 246 mm, driest December at 28 mm. Across the envelope cells the year's total runs 581 mm to 2313 mm (10th to 90th percentile of each cell's own year) (median year across the envelope cells, CHELSA; habitat calendar, northern hemisphere).
CHELSA monthly precipitation, median year across the envelope cells. The rain that falls where the species is recorded; nothing about how the plant takes water.
Light Open sky over the habitat: 15 to 36 mol/m²/day.
This species’ habitat figures, with their source.
Open sky over the habitat: 15 to 36 mol/m²/day across the year (daily light integral, median year across the envelope cells, CHELSA; the lowest 10th-percentile month across the cells is 11, the highest 90th-percentile month 38).
CHELSA shortwave radiation at each envelope cell, a daily-mean flux taken to a daily total and converted at 2.07 mol of PAR per MJ. The sky over the habitat, measured; what reaches a plant under a rock, a shrub or a shade cloth is not.
Warmth and air Cold floor -4.4 °C (1st-percentile habitat night, NASA POWER).
This species’ habitat figures, with their source.
Coldest: the 1st-percentile night over 44 years at the typical cell is -4.4 °C, the absolute minimum -7.9 °C, about 54 frost nights a year (NASA POWER daily minima). Warmest: the 99th-percentile day is 26.5 °C. Monthly means: coldest night -4.7 °C in January (across the envelope cells -19.0 °C to 5.5 °C), warmest day 28.0 °C in August (median year across the envelope cells, CHELSA). Cold floor: -4.4 °C, which is the 1st-percentile night over 44 years at the typical cell (NASA POWER).
NASA POWER daily minima and maxima 1981–2024 at the typical cell, lapse-corrected to its elevation; CHELSA monthly means, median year across the envelope cells, CHELSA. The cold floor is the figure named in its sentence. Not a measured survival limit for any plant in a pot.
Relative humidity at the habitat: 56 to 66% across the year (monthly means, median year across the envelope cells, CHELSA). A figure about the air, saying nothing about how the plant takes water.
CHELSA relative humidity, median year across the envelope cells.
The figures the cards read from are in Climate below, and where they came from in Natural habitat.
Climate across the habitat
Figures by month
| Jan | Feb | Mar | Apr | May | Jun | Jul | Aug | Sep | Oct | Nov | Dec | |
|---|---|---|---|---|---|---|---|---|---|---|---|---|
| Day °C | 3 / -8–11 | 5 / -4–12 | 10 / 4–16 | 16 / 12–23 | 21 / 18–27 | 25 / 22–29 | 27 / 25–31 | 28 / 25–30 | 24 / 20–27 | 19 / 13–23 | 12 / 3–19 | 6 / -5–14 |
| Night °C | -5 / -19–6 | -3 / -15–6 | 1 / -7–9 | 7 / 2–14 | 12 / 8–18 | 17 / 14–22 | 21 / 17–25 | 22 / 17–25 | 17 / 11–22 | 10 / 3–17 | 3 / -7–12 | -2 / -15–8 |
| Rain mm | 31 / 5–91 | 37 / 6–114 | 59 / 15–159 | 85 / 27–167 | 110 / 50–234 | 160 / 84–306 | 246 / 143–410 | 224 / 125–349 | 169 / 55–257 | 62 / 28–188 | 54 / 13–119 | 28 / 7–76 |
| DLI | 17 / 14–19 | 22 / 19–24 | 29 / 23–30 | 34 / 29–36 | 36 / 31–38 | 35 / 29–38 | 31 / 27–35 | 30 / 28–34 | 27 / 24–29 | 23 / 19–25 | 17 / 14–19 | 15 / 11–17 |
| RH % | 57 / 53–65 | 56 / 52–64 | 57 / 50–63 | 57 / 48–63 | 59 / 50–65 | 62 / 55–68 | 66 / 61–70 | 65 / 61–68 | 62 / 57–66 | 58 / 54–63 | 57 / 54–62 | 57 / 53–63 |
Each figure is the median across the 703 grid cells holding the 746 in-range records, with the 10th–90th percentile span across those cells after the slash where it differs. Extremes and elevation were read at the typical cell 1095:6380 (35.225, 139.025). Over 44 years there: absolute minimum -7.9 °C, 1st-percentile night -4.4 °C, 99th-percentile day 26.5 °C. Normals: CHELSA V2.1 1981–2010 climatology, 0.05° cells (each the mean of ~36 1 km pixels). Envelope: median and 10th–90th percentile of each month across the 703 distinct grid cells holding the 746 in-range records; extremes and elevation at the typical cell 1095:6380 (its coldest month's mean night nearest the median across cells); its position is the cell centre. Extremes: NASA POWER (MERRA-2) daily 1981–2024, cell 35.00_138.750, lapse-corrected +676 m at 6.5 °C/km. Elevation: ETOPO 2022, 907 m (cell mean).
Natural habitat
Photographs
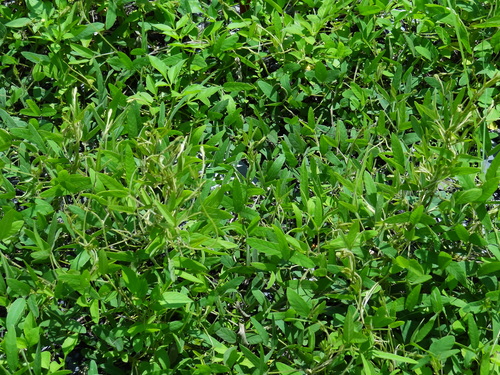
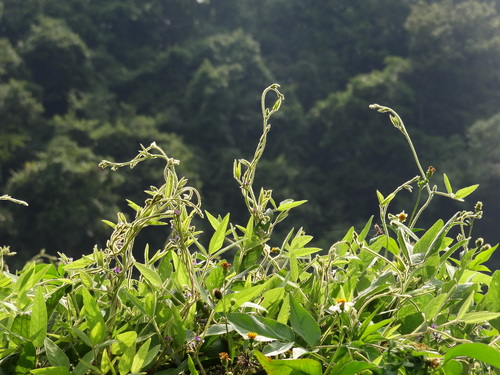

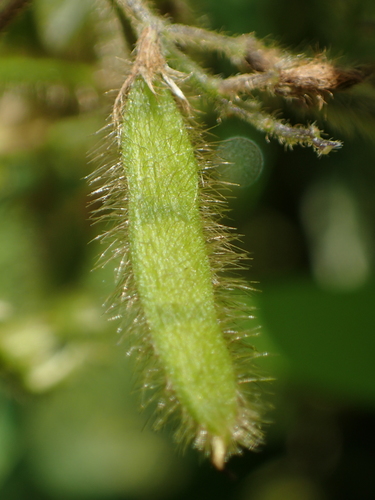
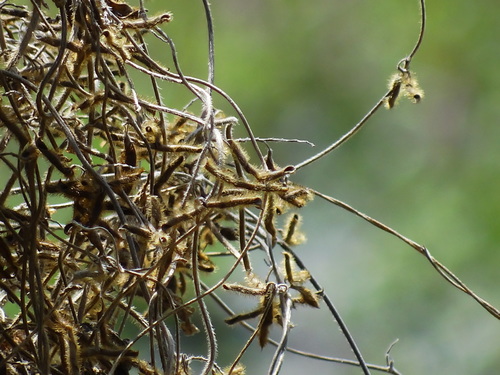
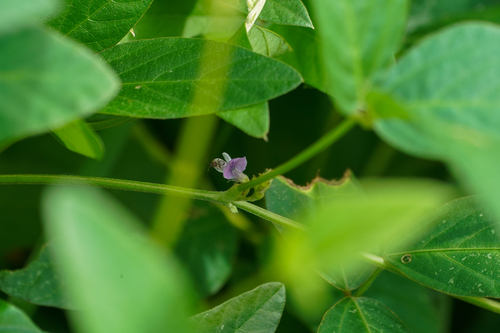
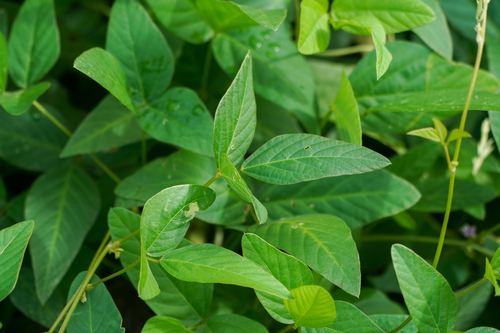
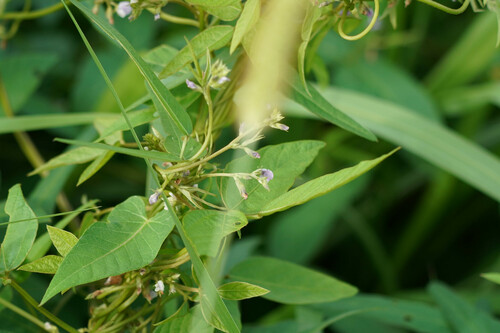
Photographs: no rights reserved · CC0 (5); (c) WATANABE Hitoshi 渡辺仁, some rights reserved (CC BY) (3).
Photographs: iNaturalist did not answer when this page was built; what is shown came from the sources that did.
Papers naming this species
Works whose title or abstract names Glycine max, most cited first, from OpenAlex (CC0). A mention, not a cultivation source: nothing on this page is drawn from them.
Related
Similar habitat climate the 6 species whose habitat climate is nearest this one's: mean day and night, month by month, and rain on a log scale, in calendar order, so a habitat with the same seasons six months out is far, not near. Nothing else counts: not range, not family.
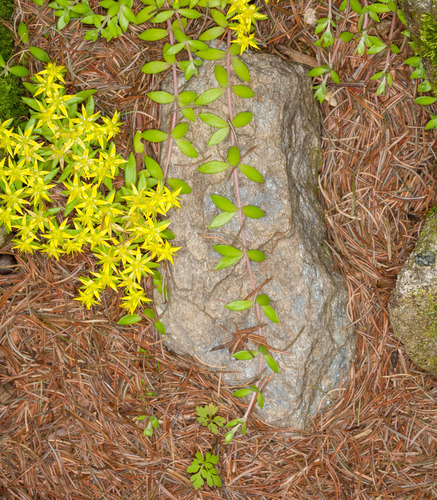 Sedum sarmentosum Star sedum, Stringy Stonecrop, Trailing Stonecrop, Yellow Moss, Gold Moss, Graveyard Moss
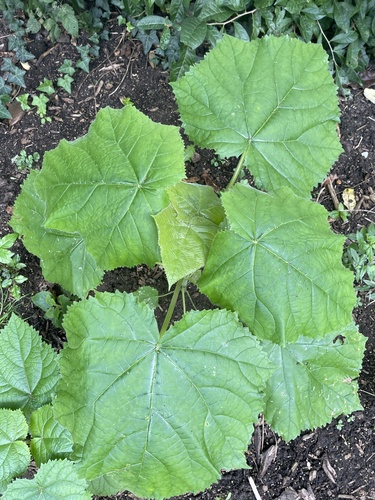 Paulownia tomentosa Foxglove-Tree
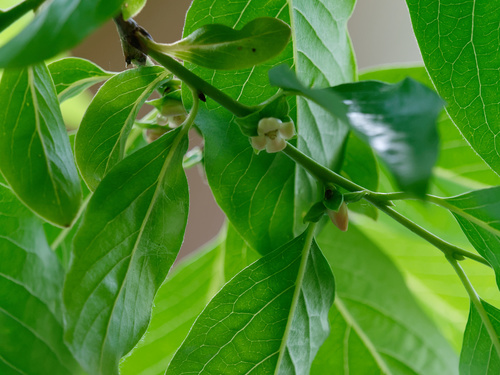 Diospyros lotus Caucasian Persimmon
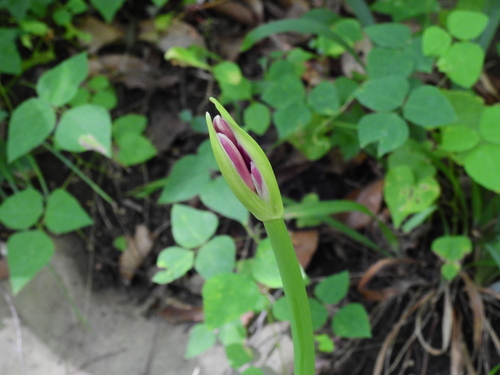 Lycoris squamigera Magic-lily
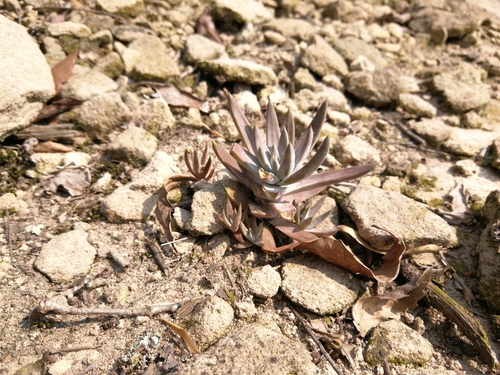 Orostachys japonica Rock pine
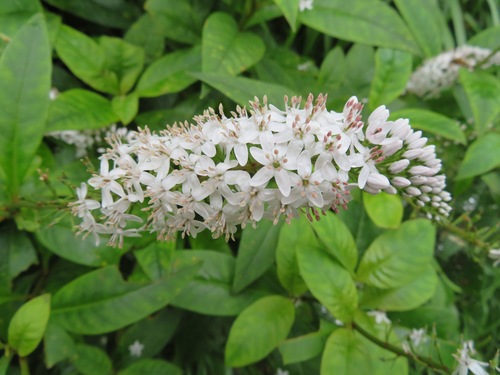 Lysimachia clethroides Gooseneck Loosestrife
History & registers
Where this page came from built 2026-09-20 · dossier v2 · node
gbif.species answeredcarried from build of 2026-09-19 (offline re-derivation; the backbone was not asked)gbif.synonyms answeredcarried from build of 2026-09-19 (offline re-derivation; the backbone was not asked)gbif.vernacular answeredcarried from build of 2026-09-19 (offline re-derivation; the backbone was not asked)wcvp.distribution answeredgbif.occurrences answeredGBIF occurrence download https://doi.org/10.15468/dl.3h4zamclimate answeredwikidata answeredcarried from build of 2026-09-19 (rederive); that build: carried from build of 2026-09-19 (rederive)wikipedia answeredcarried from build of 2026-09-19; this build: skippedinat.taxon not askedinat.photos.wild answeredcarried from build of 2026-09-19; this build: skippedinat.photos.cultivated nothing to reportcarried from build of 2026-09-19 (rederive); that build: carried from build of 2026-09-19 (rederive)commons nothing to reportcarried from build of 2026-09-19 (rederive); that build: carried from build of 2026-09-19 (rederive)gbif.media answeredopenalex answeredcarried from build of 2026-09-19; this build: skippedEvery upstream is recorded as having answered, reported nothing, or refused. Only “nothing to report” is ever shown as an absence. Records came from 150 datasets via GBIF.org; each carries its own licence.