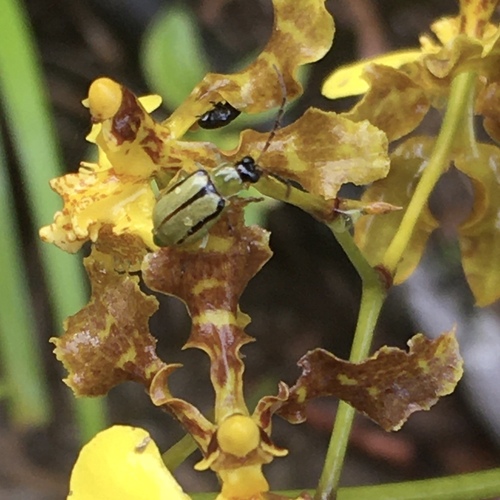


 6 photographs ›
At a glance
- Jan
- Feb
- Mar, shaded
- Apr, shaded
- May, shaded
- Jun, shaded
- Jul, shaded
- Aug, shaded
- Sep
- Oct
- Nov
- Dec
From few records: 10 records in 10 grid cells. The records.
Cultivation
Seasons
The rain rule reads a sharp season: 70% of the median year's rain (954 mm of 1,266 mm) falls in March to August. The temperature curve is flat, 3.7 °C between the warmest and coldest month, so the growing-season rule does not infer a growing season from it. Months are the habitat's, southern hemisphere. The habitat lies within 10° of the equator, where the shift rule does not apply, so they are not shifted for a collection elsewhere.
Rain
1,266 mm in the median year at the habitat, 954 mm of it March to August. Wettest month June at 192 mm, driest month November at 24 mm. Across the grid cells of the range the year's total runs 817 mm to 1,731 mm, the 10th to 90th percentile of each cell's own year. The median of the cells' own yearly totals, 1,205 mm, is the year's rain at the top of the page; the 1,266 mm here is the median year's, the twelve monthly medians added, which the rain rule reads. Habitat calendar, southern hemisphere; median year across the grid cells of the range, CHELSA.
Light
Open sky over the habitat: 26 to 41 mol/m²/day across the year (daily light integral, median year across the grid cells of the range, CHELSA; the lowest 10th-percentile month across the cells is 24, the highest 90th-percentile month 43).
Warmth and air
Monthly means: the coldest month's mean nightly low 18.8 °C in August (across the grid cells of the range 16.4 °C to 20.6 °C), the warmest month's mean daily high 29.8 °C in January and November (median year across the grid cells of the range, CHELSA). Cold floor: none read. The nearest figure is 18.8 °C, the coldest month's mean nightly low, August, in the median year (CHELSA); a month's mean of its nightly lows is warmer than the nights a floor is read from. The daily extremes were read at a weather cell whose ground is too far above or below the typical spot to correct for, and are not used.
Relative humidity at the habitat: 62 to 68% across the year (monthly means, median year across the grid cells of the range, CHELSA). A figure about the air, saying nothing about how the plant takes water.
How this section is made
Each card states this species' habitat figures with their sources, and what two fixed rules read from them; nothing here says what the plant does, wants or tolerates. The rules · the terms.
Seasons. Read from the median year of CHELSA monthly rainfall and mean temperature across the grid cells of the range: the rain rule takes the smallest set of months carrying 70% of the rain and calls it winter when its mean is more than half a degree below the year's, summer when more than that above, and neither in between; the temperature rule, used only under 120 mm, names the cooler six months when they are at least a degree cooler than the other six. Months are shifted for the other hemisphere only where the temperature curve moves 4 °C or more and the habitat lies 10° or more from the equator. A reading of the curves, not an observation of the plant.
Rain. CHELSA monthly precipitation, median year across the grid cells of the range. The rain that falls where the species is recorded; nothing about how the plant takes water.
Light. CHELSA shortwave radiation at each envelope cell, a daily-mean flux taken to a daily total and converted at 2.07 mol of PAR per MJ. The sky over the habitat, measured; what reaches a plant under a rock, a shrub or a shade cloth is not.
Temperature. CHELSA monthly means, median year across the grid cells of the range. No cold floor is read without a daily extremes series; the coldest month's mean nightly low named in its sentence is not one. Not a measured survival limit for any plant in a pot.
Humidity. CHELSA relative humidity, median year across the grid cells of the range.
Climate across the habitat
From few records: this habitat climate is read from 10 records in 10 grid cells; a page says so under 12 records or 5 cells, and shows the figures as read.
Habitat months, southern hemisphere
Mean daily high from 26 °C in Jun, Jul and Aug to 30 °C in Jan, Feb, Nov and Dec; mean nightly low from 19 °C in Jul, Aug and Sep to 22 °C in Mar. The cold quarter, Jul to Sep, is the three months around the coldest month's mean nightly low, centred on the 3 months in a row that tie for it. 1,266 mm of rain in the median year (the twelve monthly medians added), the wettest month Jun. The bands show the 10th to 90th percentile across 10 habitat cells. Beneath: daily light integral and relative humidity through the year, each on its own scale.
Figures by month
| Figure | Jan | Feb | Mar | Apr | May | Jun | Jul | Aug | Sep | Oct | Nov | Dec |
|---|---|---|---|---|---|---|---|---|---|---|---|---|
| Day °C | 30 / 28–31 | 30 / 28–31 | 29 / 27–31 | 29 / 26–30 | 28 / 25–28 | 26 / 23–27 | 26 / 22–27 | 26 / 23–28 | 27 / 25–30 | 29 / 27–32 | 30 / 28–32 | 30 / 28–31 |
| Night °C | 21 / 19–23 | 21 / 19–23 | 22 / 19–23 | 21 / 19–23 | 21 / 19–22 | 20 / 18–22 | 19 / 17–21 | 19 / 16–21 | 19 / 17–21 | 20 / 17–22 | 21 / 18–23 | 21 / 18–23 |
| Rain mm | 64 / 46–112 | 82 / 66–137 | 145 / 102–194 | 159 / 122–235 | 178 / 77–237 | 192 / 65–276 | 166 / 44–269 | 114 / 15–159 | 65 / 9–86 | 30 / 10–43 | 24 / 12–35 | 47 / 28–54 |
| DLI | 39 / 37–40 | 39 / 37–39 | 37 / 35–37 | 33 / 31–33 | 29 / 27–30 | 26 / 24–29 | 26 / 25–30 | 30 / 29–34 | 35 / 34–41 | 40 / 38–43 | 41 / 39–42 | 39 / 38–41 |
| RH % | 63 / 61–66 | 63 / 61–68 | 64 / 63–69 | 66 / 65–71 | 67 / 63–72 | 68 / 64–72 | 66 / 63–72 | 65 / 60–71 | 63 / 59–68 | 63 / 58–65 | 62 / 58–65 | 62 / 59–66 |
The daily extremes were not used: the record low, 19.7 °C, is warmer than the coldest month's mean nightly low across the range, 18.8 °C, which no night series of the habitat can give. So no cold floor is read for this species, and the coldest month's mean nightly low is not taken as one. What that cell gave, so corrected, over 44 years: absolute minimum 19.7 °C, 1st-percentile night 20.8 °C.
How this section is made
Natural habitat
How this section is made
Photographs
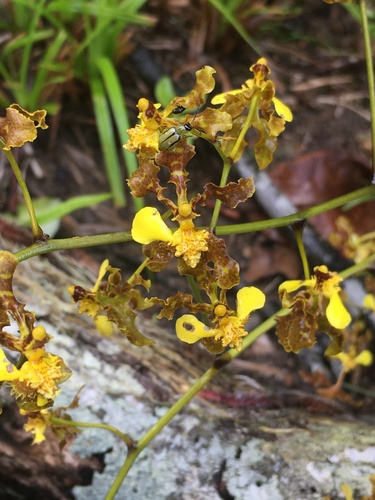
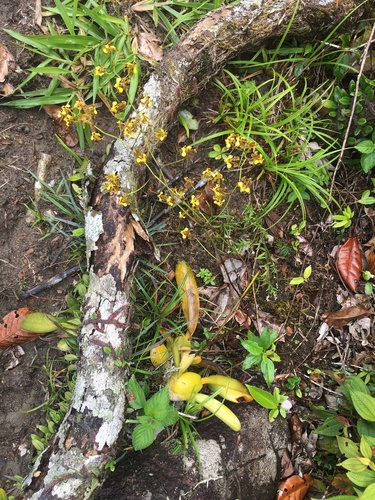
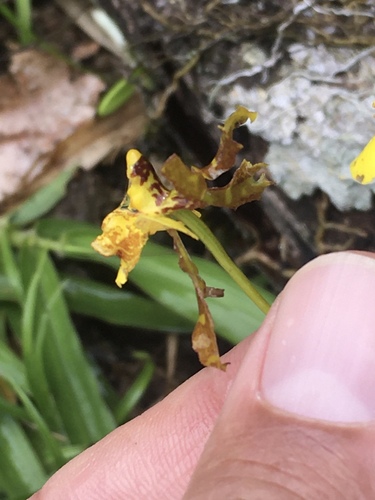
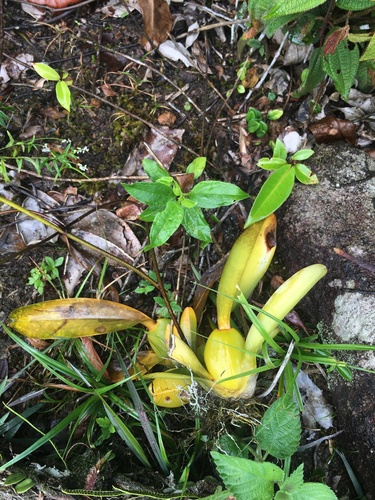
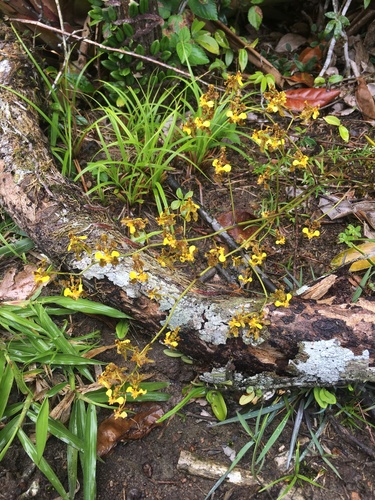
Photographs: (c) B. Phalan, some rights reserved (CC BY) (5).
Related
Similar habitat climate The 6 nearest by mean daily high, mean nightly low and rain, month by month. How.
 Aechmea fulgens Coralberry Photo: CC BY-SA, Carlos Henrique
 Aechmea leptantha Bromeliaceae Photo: CC BY-SA, Carlos Henrique
 Hippeastrum stylosum Amaryllidaceae Photo: CC BY-SA, Carlos Henrique
 Solanum paniculatum Solanaceae Photo: CC BY, Eli
 Anthurium affine Araceae Photo: CC BY-SA, vitordematos12 Stachytarpheta microphylla Dwarf Red Porterweed
Other Gomesa 19 in the reference
 Gomesa bifolia Dancing ladies Photo: CC BY, RAP
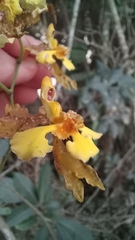 Gomesa ciliata Orchidaceae Photo: CC BY, JG
 Gomesa colorata Orchidaceae Photo: CC BY-SA, Naoki Takebayashi
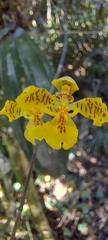 Gomesa cornigera Orchidaceae Photo: CC BY-SA, Adri Baier
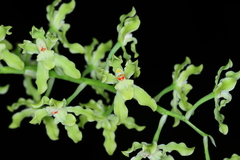 Gomesa crispa Orchidaceae Photo: CC BY, Carlos Alexandre Mattos Raposo
 Gomesa croesus Orchidaceae Photo: CC BY-SA, Arne and Bent Larsen, Haarby, Denmark
 Gomesa echinata Orchidaceae Photo: CC BY-SA, Dalton Holland Baptista
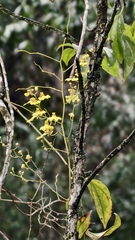 Gomesa flexuosa Dancing doll orchid Photo: CC BY, fmunoz
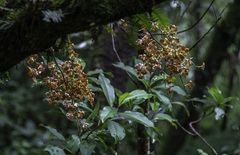 Gomesa forbesii Orchidaceae Photo: CC0, author not stated
 Gomesa gardneri Orchidaceae Photo: CC0, author not stated
 Gomesa longipes Orchidaceae Photo: CC BY, Fabrício Mil Homens Riella
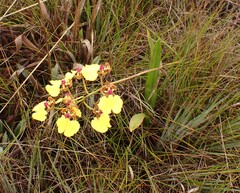 Gomesa maculosa Orchidaceae Photo: CC BY, agujaceratops all 20 ›
Names & registers
Also known as Alatiglossum barbatum; Oncidium barbatum subsp. limbatum; Oncidium barbatum subsp. microglossum; Oncidium barbatum var. johnianum; Oncidium barbatum var. labiosum and 5 more. (GBIF Backbone)
The record
Every figure here is derived from public data by a stated rule and names its source; nothing about this species is written for its page by a person or by AI, apart from the marked, credited quotations. How →
Where this page came from built 2026-10-22
gbif.species answeredasked 2026-10-22gbif.synonyms answeredasked 2026-10-22gbif.vernacular answeredasked 2026-10-22names fetched 2026-10-22wcvp.distribution answeredas of 2026-06-04gbif.occurrences answeredas of 2026-10-21GBIF occurrence download https://doi.org/10.15468/dl.hbdw64, of 2026-10-21; 1 record within 1 km of a botanic garden, herbarium or zoo left out (1 at a botanic garden or arboretum; Wikidata's list)climate answeredasked 2026-10-22climate.extremes answeredasked 2026-10-22NASA POWER (MERRA-2) daily 1981–2024, cell -9.50_-35.625, lapse-corrected +113 m at 6.5 °C/km; read, and set aside: the record low, 19.7 °C, is warmer than the coldest month's mean nightly low across the range, 18.8 °C, which no night series of the habitat can give, so no cold floor is shownwikidata answeredasked 2026-10-22wikipedia nothing to reportasked 2026-10-22inat.photos.wild answeredasked 2026-10-22from iNaturalist's open data of 2026-09-27: research-grade observations with an open-licence photograph, the 24 whose photographs iNaturalist received last (the open data holds no votes); filled 2026-10-22inat.photos.cultivated not askedgbif.media answeredasked 2026-10-22none of the photographs on this page is credited to GBIF: those shown are other sources', and GBIF's were the same photographs or were set aside by the photograph rulescommons nothing to reportasked 2026-10-22openalex not askednot yet asked for this reference; a later fill takes the papers from OpenAlex's snapshotEvery source is recorded as having answered, reported nothing, refused, failed, not been asked, or answered twice where one answer is taken (“not taken: two items answered”), and, for a source asked when this page was built, when: the figures are as the source held them that day; a source read from a file (Kew's World Checklist, a GBIF download) says "as of" the file's day instead; a row carried from an earlier build of the page names that build instead. Only “nothing to report” is ever shown as an absence. Records came from 23 datasets via GBIF.org; each carries its own licence.