 33 photographs ›
At a glance
- Jan
- Feb
- Mar
- Apr
- May, shaded
- Jun, shaded
- Jul, shaded
- Aug, shaded
- Sep, shaded
- Oct, shaded
- Nov
- Dec
Summary
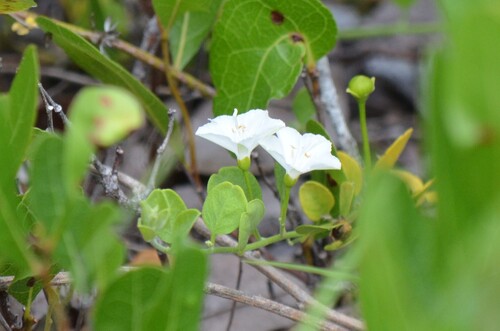
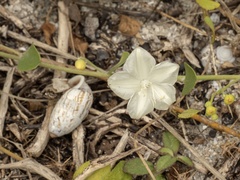
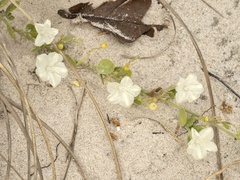
Jacquemontia reclinata is a rare species of flowering plant in the morning glory family known by the common names beach clustervine, reclined clustervine, and beach jacquemontia. It is endemic to the southeastern coast of Florida, mainly within the South Florida metropolitan area, in the United States, where little of its native habitat remains. It is a federally listed endangered species.
Quoted from Wikipedia, "Jacquemontia reclinata", CC BY-SA 4.0.
Cultivation
Seasons
The rain rule reads a summer growing season: 70% of the median year's rain (1,087 mm of 1,516 mm) falls in May to October, warmer than the year (wet-season mean 26.8 °C against a yearly mean of 24.2 °C). Months are the habitat's, northern hemisphere; shifted six months for a southern-hemisphere collection: November to April.
Rain
1,516 mm in the median year at the habitat, 1,087 mm of it May to October. Wettest month September at 239 mm, driest month January at 50 mm. Across the grid cells of the range the year's total runs 1,448 mm to 1,582 mm, the 10th to 90th percentile of each cell's own year. The median of the cells' own yearly totals, 1,536 mm, is the year's rain at the top of the page; the 1,516 mm here is the median year's, the twelve monthly medians added, which the rain rule reads. Habitat calendar, northern hemisphere; median year across the grid cells of the range, CHELSA.
Light
Open sky over the habitat: 20 to 41 mol/m²/day across the year (daily light integral, median year across the grid cells of the range, CHELSA; the lowest 10th-percentile month across the cells is 20, the highest 90th-percentile month 42).
Warmth and air
Monthly means: the coldest month's mean nightly low 17.5 °C in January (across the grid cells of the range 13.6 °C to 18.8 °C), the warmest month's mean daily high 30.0 °C in August (median year across the grid cells of the range, CHELSA). Cold floor: none read. The nearest figure is 17.5 °C, the coldest month's mean nightly low, January, in the median year (CHELSA); a month's mean of its nightly lows is warmer than the nights a floor is read from. The daily extremes were read at a weather cell that is mostly sea and are not used.
Relative humidity at the habitat: 58 to 63% across the year (monthly means, median year across the grid cells of the range, CHELSA). A figure about the air, saying nothing about how the plant takes water.
How this section is made
Each card states this species' habitat figures with their sources, and what two fixed rules read from them; nothing here says what the plant does, wants or tolerates. The rules · the terms.
Seasons. Read from the median year of CHELSA monthly rainfall and mean temperature across the grid cells of the range: the rain rule takes the smallest set of months carrying 70% of the rain and calls it winter when its mean is more than half a degree below the year's, summer when more than that above, and neither in between; the temperature rule, used only under 120 mm, names the cooler six months when they are at least a degree cooler than the other six. Months are shifted for the other hemisphere only where the temperature curve moves 4 °C or more and the habitat lies 10° or more from the equator. A reading of the curves, not an observation of the plant.
Rain. CHELSA monthly precipitation, median year across the grid cells of the range. The rain that falls where the species is recorded; nothing about how the plant takes water.
Light. CHELSA shortwave radiation at each envelope cell, a daily-mean flux taken to a daily total and converted at 2.07 mol of PAR per MJ. The sky over the habitat, measured; what reaches a plant under a rock, a shrub or a shade cloth is not.
Temperature. CHELSA monthly means, median year across the grid cells of the range. No cold floor is read without a daily extremes series; the coldest month's mean nightly low named in its sentence is not one. Not a measured survival limit for any plant in a pot.
Humidity. CHELSA relative humidity, median year across the grid cells of the range.
Climate across the habitat
Habitat months, northern hemisphere
Mean daily high from 23 °C in Jan to 30 °C in Jul and Aug; mean nightly low from 18 °C in Jan and Feb to 26 °C in Jul and Aug. The cold quarter, Dec to Feb, is the three months around the coldest month's mean nightly low, centred on the 2 months in a row that tie for it. 1,516 mm of rain in the median year (the twelve monthly medians added), the wettest month Sep. The bands show the 10th to 90th percentile across 14 habitat cells. Beneath: daily light integral and relative humidity through the year, each on its own scale.
Figures by month
| Figure | Jan | Feb | Mar | Apr | May | Jun | Jul | Aug | Sep | Oct | Nov | Dec |
|---|---|---|---|---|---|---|---|---|---|---|---|---|
| Day °C | 23 / 21–23 | 24 / 23–24 | 24 / 24–25 | 26 / 25–27 | 28 / 27–30 | 29 / 28–31 | 30 / 29–31 | 30 / 29–31 | 29 / 29–30 | 28 / 27–28 | 26 / 25–26 | 24 / 22–24 |
| Night °C | 18 / 14–19 | 18 / 15–19 | 19 / 16–20 | 21 / 18–22 | 23 / 21–24 | 25 / 24–26 | 26 / 24–26 | 26 / 24–26 | 25 / 24–26 | 24 / 21–25 | 21 / 18–22 | 19 / 15–20 |
| Rain mm | 50 / 48–65 | 74 / 65–76 | 88 / 73–109 | 76 / 69–89 | 124 / 81–132 | 216 / 201–226 | 169 / 150–215 | 189 / 184–227 | 239 / 210–249 | 150 / 97–155 | 81 / 59–92 | 60 / 53–77 |
| DLI | 23 / 22–23 | 27 / 27–28 | 33 / 32–34 | 39 / 39–40 | 41 / 40–42 | 38 / 38–39 | 40 / 38–41 | 37 / 36–38 | 32 / 31–33 | 28 / 27–29 | 23 / 23–24 | 20 / 20–21 |
| RH % | 58 | 59 / 58–59 | 58 / 58–59 | 58 / 57–59 | 60 / 59–61 | 63 / 62–64 | 63 / 62–63 | 63 / 62–63 | 63 | 61 / 60–61 | 59 / 58–59 | 59 / 58–59 |
The daily extremes were read at a NASA POWER cell that is 40% land: neither it nor the next candidates whose coldest month's mean nightly low is within 2 °C of the median across cells sit in a POWER cell that is mostly land, and the rule reads a cold floor only from a cell that is mostly land, so none is read for this species. Nor is the coldest month's mean nightly low taken as one: it is a mean of a month's lows, not its coldest night. What that cell gave over 44 years: absolute minimum 3.5 °C, 1st-percentile night 13.0 °C, 99th-percentile day 31.2 °C.
How this section is made
Natural habitat
How this section is made
Photographs

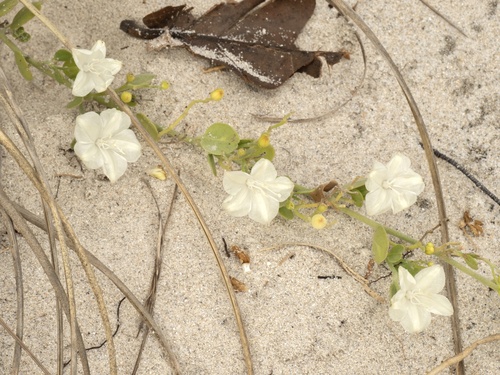
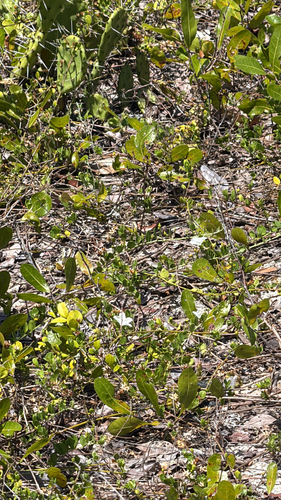
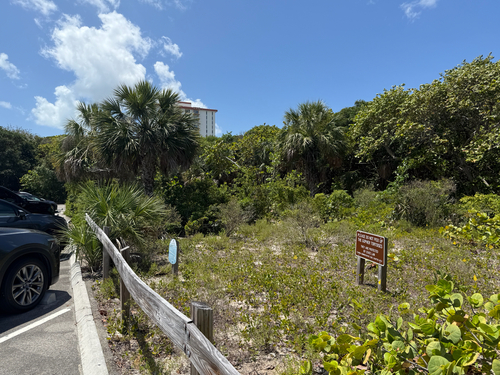

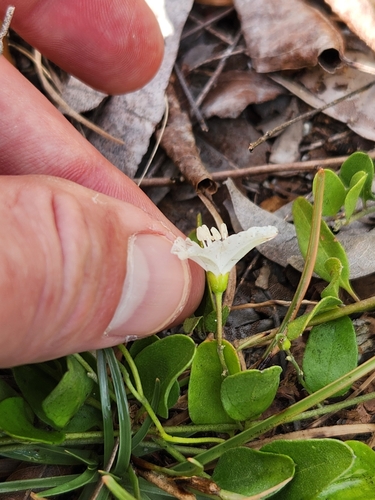
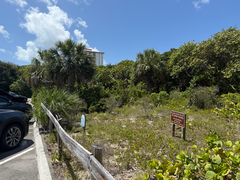
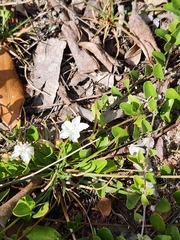
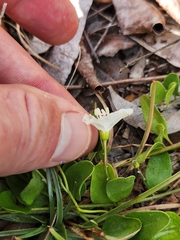
Photographs: (c) Turner Brockman, some rights reserved (CC BY-SA) (2); (c) sblumen, some rights reserved (CC BY) (2); (c) Asher Budnik, some rights reserved (CC BY) (2).
Related
Similar habitat climate The 6 nearest by mean daily high, mean nightly low and rain, month by month. How.
 Sophora tomentosa Yellow necklacepod Photo: CC BY, Moogoo Lee
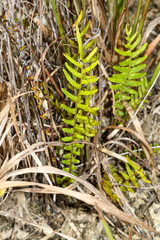 Pteris bahamensis Bahama brake Photo: CC BY, Tom Field
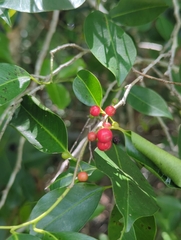 Ilex krugiana Krug's holly Photo: CC BY, Tom Field
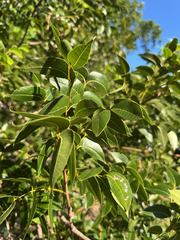 Swietenia mahagoni West Indian mahogany Photo: CC0, author not stated
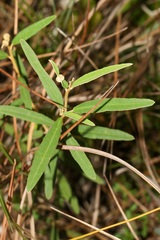 Croton linearis Pineland croton Photo: CC BY, Tom Field
 Fimbristylis cymosa Tropical fimbry Photo: CC BY, Neal Kelso
Other Jacquemontia 10 in the reference
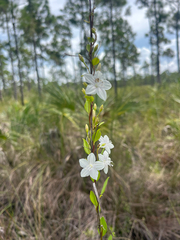 Jacquemontia curtissii Pineland clustervine Photo: CC0, author not stated
 Jacquemontia nodiflora Convolvulaceae Photo: CC BY, David LaMagna
 Jacquemontia paniculata Convolvulaceae Photo: CC BY, smathichong
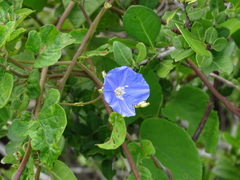 Jacquemontia pentanthos Skyblue clustervine Photo: CC BY, Alexis López Hernández
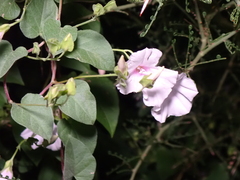 Jacquemontia pringlei Pringle's clustervine Photo: CC0, author not stated
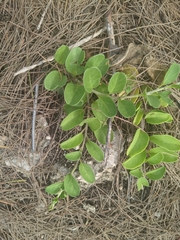 Jacquemontia sandwicensis Oval-leaf clustervine Photo: CC0, author not stated
 Jacquemontia solanifolia Cambustera de costa Photo: CC BY-SA, Olivier Chiodi
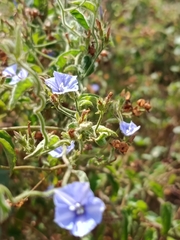 Jacquemontia sphaerostigma Convolvulaceae Photo: CC BY, Arturo Benavides Mendoza
 Jacquemontia tamnifolia Hairy clustervine Photo: CC BY-SA, Antonia Bookbinder
Names & registers
The record
Every figure here is derived from public data by a stated rule and names its source; nothing about this species is written for its page by a person or by AI, apart from the marked, credited quotations. How →
Where this page came from built 2026-10-22
gbif.species answeredasked 2026-10-22gbif.synonyms answeredasked 2026-10-22gbif.vernacular answeredasked 2026-10-22names fetched 2026-10-22wcvp.distribution answeredas of 2026-06-04gbif.occurrences answeredas of 2026-10-21GBIF occurrence download https://doi.org/10.15468/dl.hbdw64, of 2026-10-21; 1 record within 1 km of a botanic garden, herbarium or zoo left out (1 at a botanic garden or arboretum; Wikidata's list)climate answeredasked 2026-10-22climate.extremes answeredasked 2026-10-22NASA POWER (MERRA-2) daily 1981–2024, cell 26.00_-80.000, lapse-corrected -2 m at 6.5 °C/km; read, and set aside: NASA POWER's cell is mostly sea (40% land), so no cold floor is shownwikidata answeredasked 2026-10-22IPNI and POWO linked by Kew's number for Jacquemontia reclinata House (the item's: IPNI 270239-1, POWO 131160-2)wikipedia answeredasked 2026-10-22inat.photos.wild answeredasked 2026-10-22from iNaturalist's open data of 2026-09-27: research-grade observations with an open-licence photograph, the 24 whose photographs iNaturalist received last (the open data holds no votes); filled 2026-10-22inat.photos.cultivated not askedgbif.media answeredasked 2026-10-22openalex not askednot yet asked for this reference; a later fill takes the papers from OpenAlex's snapshotEvery source is recorded as having answered, reported nothing, refused, failed, not been asked, or answered twice where one answer is taken (“not taken: two items answered”), and, for a source asked when this page was built, when: the figures are as the source held them that day; a source read from a file (Kew's World Checklist, a GBIF download) says "as of" the file's day instead; a row carried from an earlier build of the page names that build instead. Only “nothing to report” is ever shown as an absence. Records came from 3 datasets via GBIF.org; each carries its own licence.