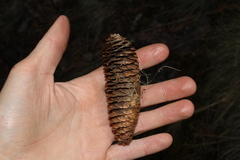
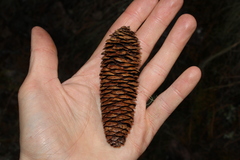
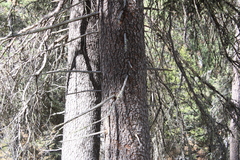
 87 photographs ›
At a glance
- Jan
- Feb
- Mar
- Apr
- May
- Jun, shaded
- Jul, shaded
- Aug, shaded
- Sep, shaded
- Oct
- Nov
- Dec
Summary
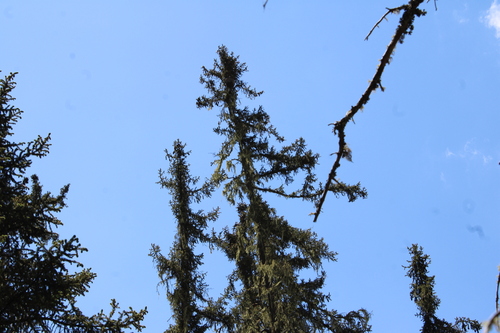
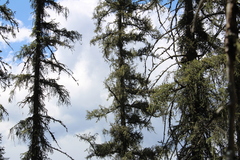
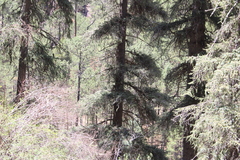
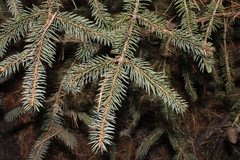
Picea chihuahuana, the Chihuahua spruce, is a medium-sized evergreen tree growing to 25–35 m tall, and with a trunk diameter of up to 1 m. It is native to northwest Mexico, where it occurs in 25 small populations in the Sierra Madre Occidental mountains in Chihuahua and Durango. It grows at moderate altitudes from 2300 to 3200 m, growing along streamsides in mountain valleys, where moisture levels in the soil are greater than the otherwise low rainfall in the area would suggest.
Quoted from Wikipedia, "Picea chihuahuana", CC BY-SA 4.0.
Cultivation
Seasons
The rain rule reads a summer growing season: 70% of the median year's rain (665 mm of 917 mm) falls in June to September, warmer than the year (wet-season mean 16.0 °C against a yearly mean of 11.4 °C). Months are the habitat's, northern hemisphere; shifted six months for a southern-hemisphere collection: December to March.
Rain
917 mm in the median year at the habitat, 665 mm of it June to September. Wettest month July at 219 mm, driest month April at 15 mm. Across the grid cells of the range the year's total runs 747 mm to 1,397 mm, the 10th to 90th percentile of each cell's own year. The median of the cells' own yearly totals, 908 mm, is the year's rain at the top of the page; the 917 mm here is the median year's, the twelve monthly medians added, which the rain rule reads. Habitat calendar, northern hemisphere; median year across the grid cells of the range, CHELSA.
Light
Open sky over the habitat: 26 to 51 mol/m²/day across the year (daily light integral, median year across the grid cells of the range, CHELSA; the lowest 10th-percentile month across the cells is 25, the highest 90th-percentile month 52).
Warmth and air
Monthly means: the coldest month's mean nightly low -0.7 °C in January (across the grid cells of the range -2.1 °C to 2.1 °C), the warmest month's mean daily high 24.1 °C in June (median year across the grid cells of the range, CHELSA). Cold floor: none read. The nearest figure is -0.7 °C, the coldest month's mean nightly low, January, in the median year (CHELSA); a month's mean of its nightly lows is warmer than the nights a floor is read from. The daily extremes were read at a weather cell whose ground is too far above or below the typical spot to correct for, and are not used.
Relative humidity at the habitat: 44 to 61% across the year (monthly means, median year across the grid cells of the range, CHELSA). A figure about the air, saying nothing about how the plant takes water.
How this section is made
Each card states this species' habitat figures with their sources, and what two fixed rules read from them; nothing here says what the plant does, wants or tolerates. The rules · the terms.
Seasons. Read from the median year of CHELSA monthly rainfall and mean temperature across the grid cells of the range: the rain rule takes the smallest set of months carrying 70% of the rain and calls it winter when its mean is more than half a degree below the year's, summer when more than that above, and neither in between; the temperature rule, used only under 120 mm, names the cooler six months when they are at least a degree cooler than the other six. Months are shifted for the other hemisphere only where the temperature curve moves 4 °C or more and the habitat lies 10° or more from the equator. A reading of the curves, not an observation of the plant.
Rain. CHELSA monthly precipitation, median year across the grid cells of the range. The rain that falls where the species is recorded; nothing about how the plant takes water.
Light. CHELSA shortwave radiation at each envelope cell, a daily-mean flux taken to a daily total and converted at 2.07 mol of PAR per MJ. The sky over the habitat, measured; what reaches a plant under a rock, a shrub or a shade cloth is not.
Temperature. CHELSA monthly means, median year across the grid cells of the range. No cold floor is read without a daily extremes series; the coldest month's mean nightly low named in its sentence is not one. Not a measured survival limit for any plant in a pot.
Humidity. CHELSA relative humidity, median year across the grid cells of the range.
Climate across the habitat
Habitat months, northern hemisphere
Mean daily high from 12 °C in Jan to 24 °C in Jun; mean nightly low from -1 °C in Jan to 11 °C in Jul. The cold quarter, Dec to Feb, is the three months around the coldest month's mean nightly low. 917 mm of rain in the median year (the twelve monthly medians added), the wettest month Jul. The bands show the 10th to 90th percentile across 45 habitat cells. Beneath: daily light integral and relative humidity through the year, each on its own scale.
Figures by month
| Figure | Jan | Feb | Mar | Apr | May | Jun | Jul | Aug | Sep | Oct | Nov | Dec |
|---|---|---|---|---|---|---|---|---|---|---|---|---|
| Day °C | 12 / 11–16 | 14 / 12–17 | 16 / 15–20 | 19 / 18–22 | 22 / 21–25 | 24 / 21–26 | 22 / 19–24 | 22 / 19–24 | 21 / 19–23 | 19 / 18–21 | 16 / 15–19 | 13 / 12–16 |
| Night °C | -1 / -2–2 | 0 / -2–3 | 1 / -1–4 | 4 / 2–6 | 6 / 5–9 | 10 / 8–12 | 11 / 9–12 | 10 / 9–12 | 9 / 8–11 | 6 / 5–8 | 2 / 1–5 | 0 / -1–3 |
| Rain mm | 45 / 31–77 | 29 / 17–37 | 21 / 10–28 | 15 / 8–20 | 22 / 17–38 | 110 / 83–181 | 219 / 138–323 | 201 / 140–275 | 135 / 111–208 | 50 / 44–98 | 27 / 17–56 | 43 / 21–67 |
| DLI | 28 / 27–30 | 35 / 33–37 | 43 / 42–45 | 49 / 48–49 | 51 / 50–52 | 45 / 41–47 | 38 / 33–41 | 37 / 33–40 | 35 / 32–37 | 35 / 33–36 | 30 / 29–32 | 26 / 25–29 |
| RH % | 50 / 45–53 | 49 / 44–52 | 47 / 42–49 | 44 / 41–48 | 44 / 41–51 | 52 / 48–61 | 61 / 59–63 | 61 / 60–63 | 60 / 57–63 | 54 / 52–57 | 50 / 45–52 | 50 / 45–53 |
The daily extremes were not used: the correction for elevation, +1339 m, is beyond the 1,000 m either way that a lapse rate is applied over, so the weather cell's ground is other terrain than the typical spot's. So no cold floor is read for this species, and the coldest month's mean nightly low is not taken as one. What that cell gave, so corrected, over 44 years: absolute minimum -9.5 °C, 1st-percentile night -4.4 °C.
How this section is made
Natural habitat
How this section is made
Photographs
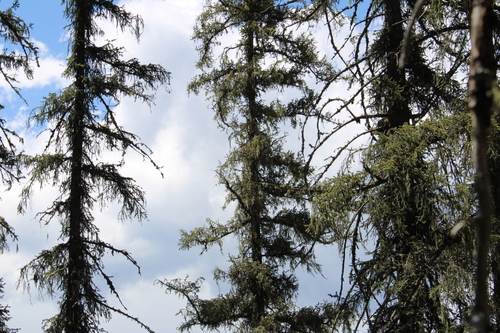
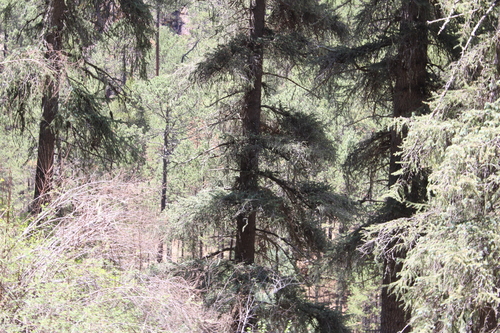
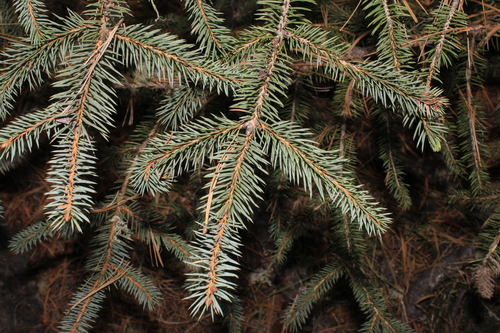
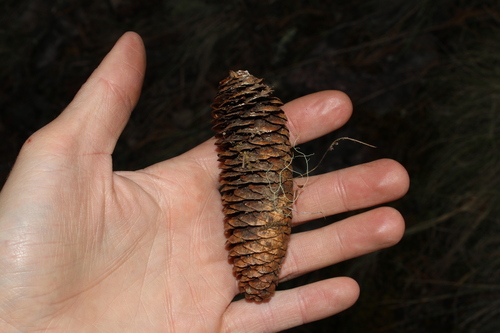
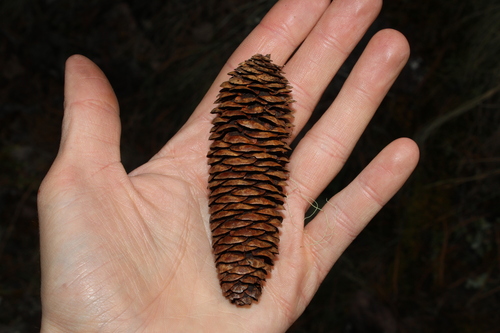
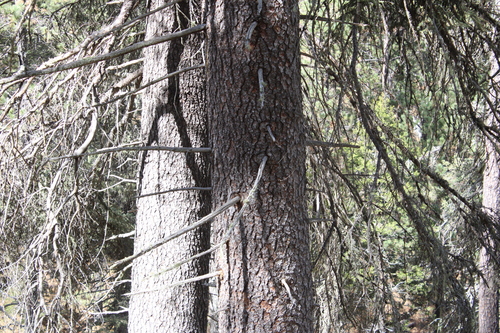
Photographs: (c) Rodolfo Maximiliano Gutiérrez-Sánchez, some rights reserved (CC BY) (6).
Related
Similar habitat climate The 6 nearest by mean daily high, mean nightly low and rain, month by month. How.
 Pinus strobiformis Southwestern white pine Photo: CC BY, Cheng-Te Hsu
 Echeveria chihuahuaensis Crassulaceae Photo: CC0, author not stated
 Aquilegia skinneri Skinner's Columbine Photo: CC BY, Elisa
 Agastache pringlei Pringle's giant hyssop Photo: CC0, author not stated
 Abies durangensis Durango Fir Photo: CC BY, Andrea Villarreal Rodríguez
 Pinus durangensis Durango Pine Photo: CC BY, Norma Piedra
Other Picea 35 in the reference
 Picea abies Norway spruce Photo: CC BY, Марина Давлетшина Picea × albertiana Pinaceae
 Picea alcoquiana Alcock's Spruce Photo: CC BY-SA, Inti-sol
 Picea asperata Dragon spruce Photo: CC BY, rduta on Flickr
 Picea brachytyla Sargent's Spruce Photo: CC0, author not stated
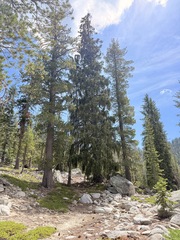 Picea breweriana Brewer spruce Photo: CC BY, Sam Eberhard
 Picea crassifolia Qinghai spruce Photo: CC0, no rights reserved
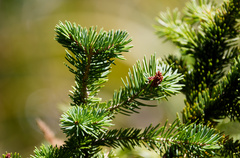 Picea engelmannii Engelmann spruce Photo: CC BY, Daughter Dad
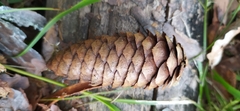 Picea × fennica Pinaceae Photo: CC0, author not stated
 Picea glehnii Sakhalin spruce Photo: CC BY, Andrew Bazdyrev
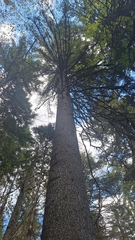 Picea jezoensis Yezo spruce Photo: CC BY, Violetta Dzizyurova
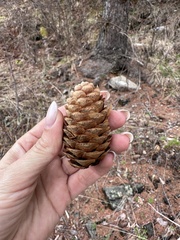 Picea koraiensis Korean spruce Photo: CC BY, Tatyana Petrenko all 36 ›
Names & registers
The record
Every figure here is derived from public data by a stated rule and names its source; nothing about this species is written for its page by a person or by AI, apart from the marked, credited quotations. How →
Where this page came from built 2026-10-22
gbif.species answeredasked 2026-10-22gbif.synonyms answeredasked 2026-10-22gbif.vernacular answeredasked 2026-10-22names fetched 2026-10-22wcvp.distribution answeredas of 2026-06-04gbif.occurrences answeredas of 2026-10-21GBIF occurrence download https://doi.org/10.15468/dl.hbdw64, of 2026-10-21; 2 records within 1 km of a botanic garden, herbarium or zoo left out (2 at a botanic garden or arboretum; Wikidata's list)climate answeredasked 2026-10-22climate.extremes answeredasked 2026-10-22NASA POWER (MERRA-2) daily 1981–2024, cell 23.50_-105.625, lapse-corrected +1339 m at 6.5 °C/km; read, and set aside: the correction for elevation, +1339 m, is beyond the 1,000 m either way that a lapse rate is applied over, so the weather cell's ground is other terrain than the typical spot's, so no cold floor is shownwikidata answeredasked 2026-10-22wikipedia answeredasked 2026-10-22inat.photos.wild answeredasked 2026-10-22from iNaturalist's open data of 2026-09-27: research-grade observations with an open-licence photograph, the 24 whose photographs iNaturalist received last (the open data holds no votes); filled 2026-10-22inat.photos.cultivated not askedgbif.media answeredasked 2026-10-22none of the photographs on this page is credited to GBIF: those shown are other sources', and GBIF's were the same photographs or were set aside by the photograph rulesopenalex not askednot yet asked for this reference; a later fill takes the papers from OpenAlex's snapshotEvery source is recorded as having answered, reported nothing, refused, failed, not been asked, or answered twice where one answer is taken (“not taken: two items answered”), and, for a source asked when this page was built, when: the figures are as the source held them that day; a source read from a file (Kew's World Checklist, a GBIF download) says "as of" the file's day instead; a row carried from an earlier build of the page names that build instead. Only “nothing to report” is ever shown as an absence. Records came from 22 datasets via GBIF.org; each carries its own licence.